There are two arduino-based systems inside my greenhouse; an environment monitor and a power supply controller. Both systems use ESP32 boards. ESP32 is a $10 microcontroller with built-in wifi. Both boards are running sketches that were written in the Arduino IDE. Each system takes sensor readings once per minute and publishes results to the cloud.
|
|
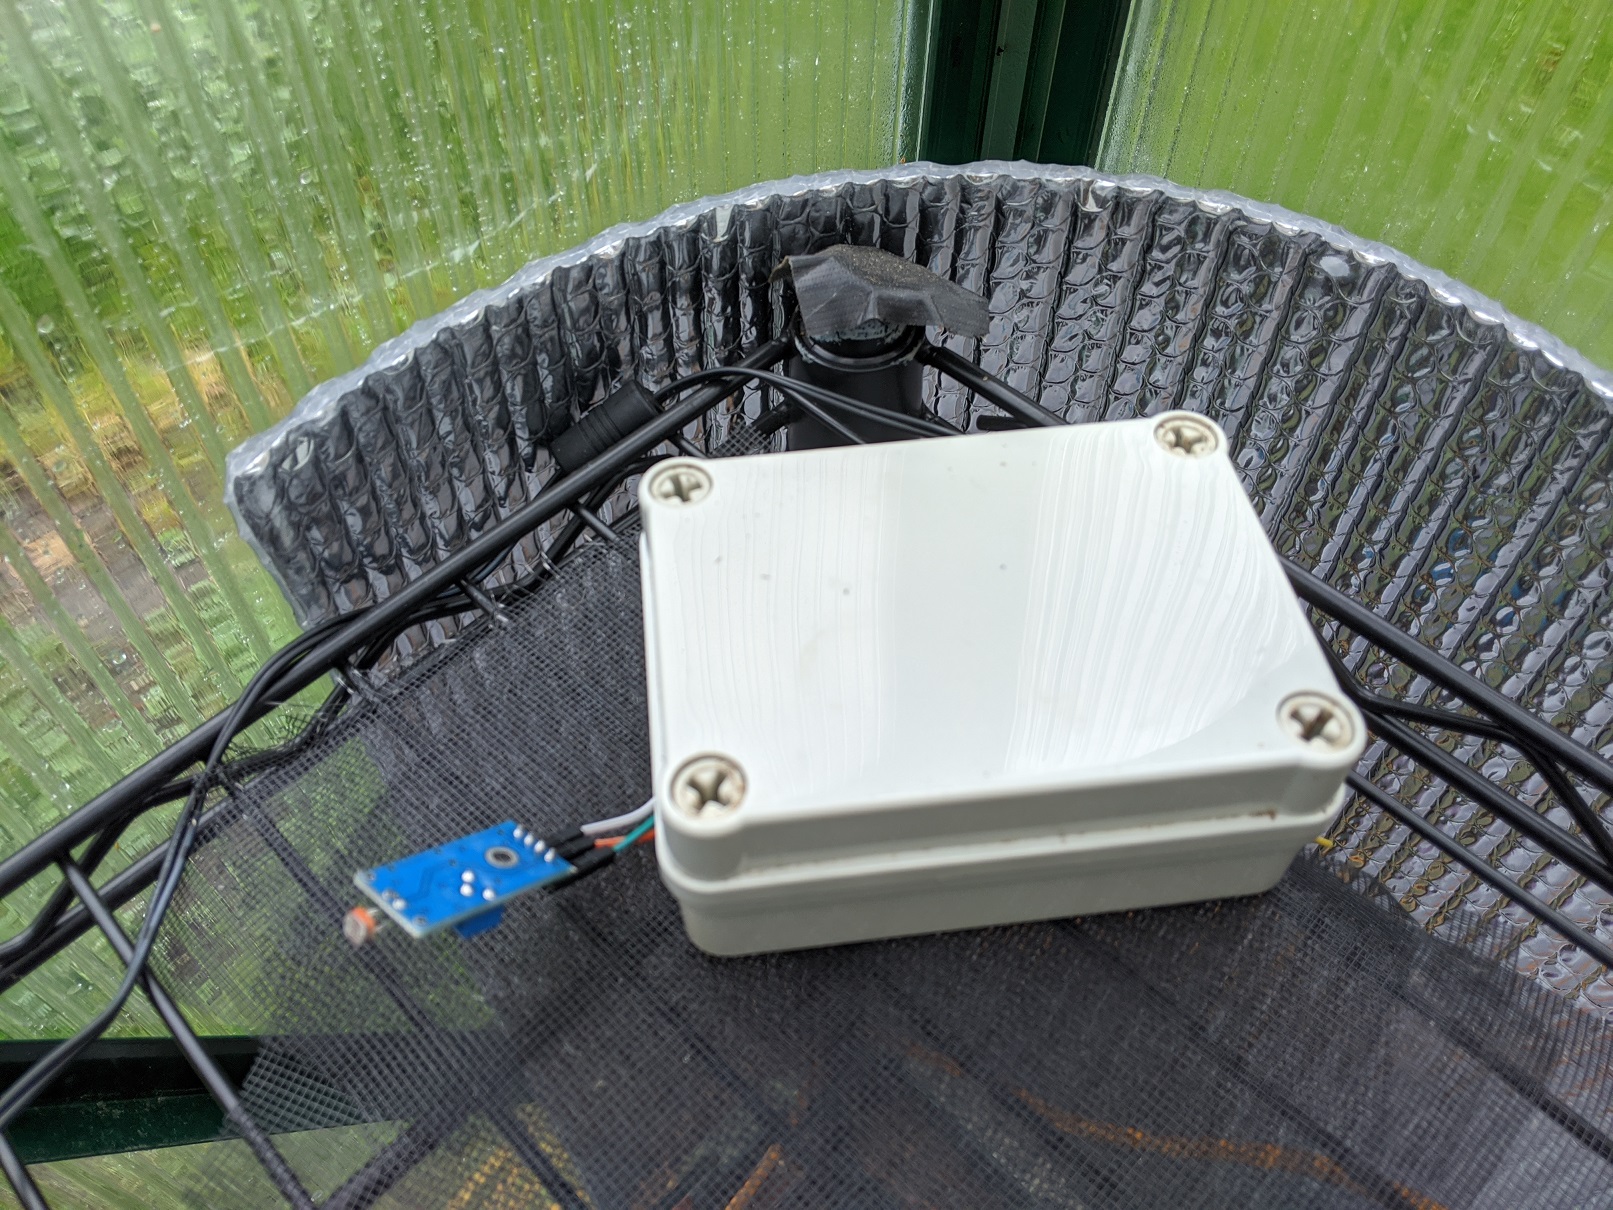
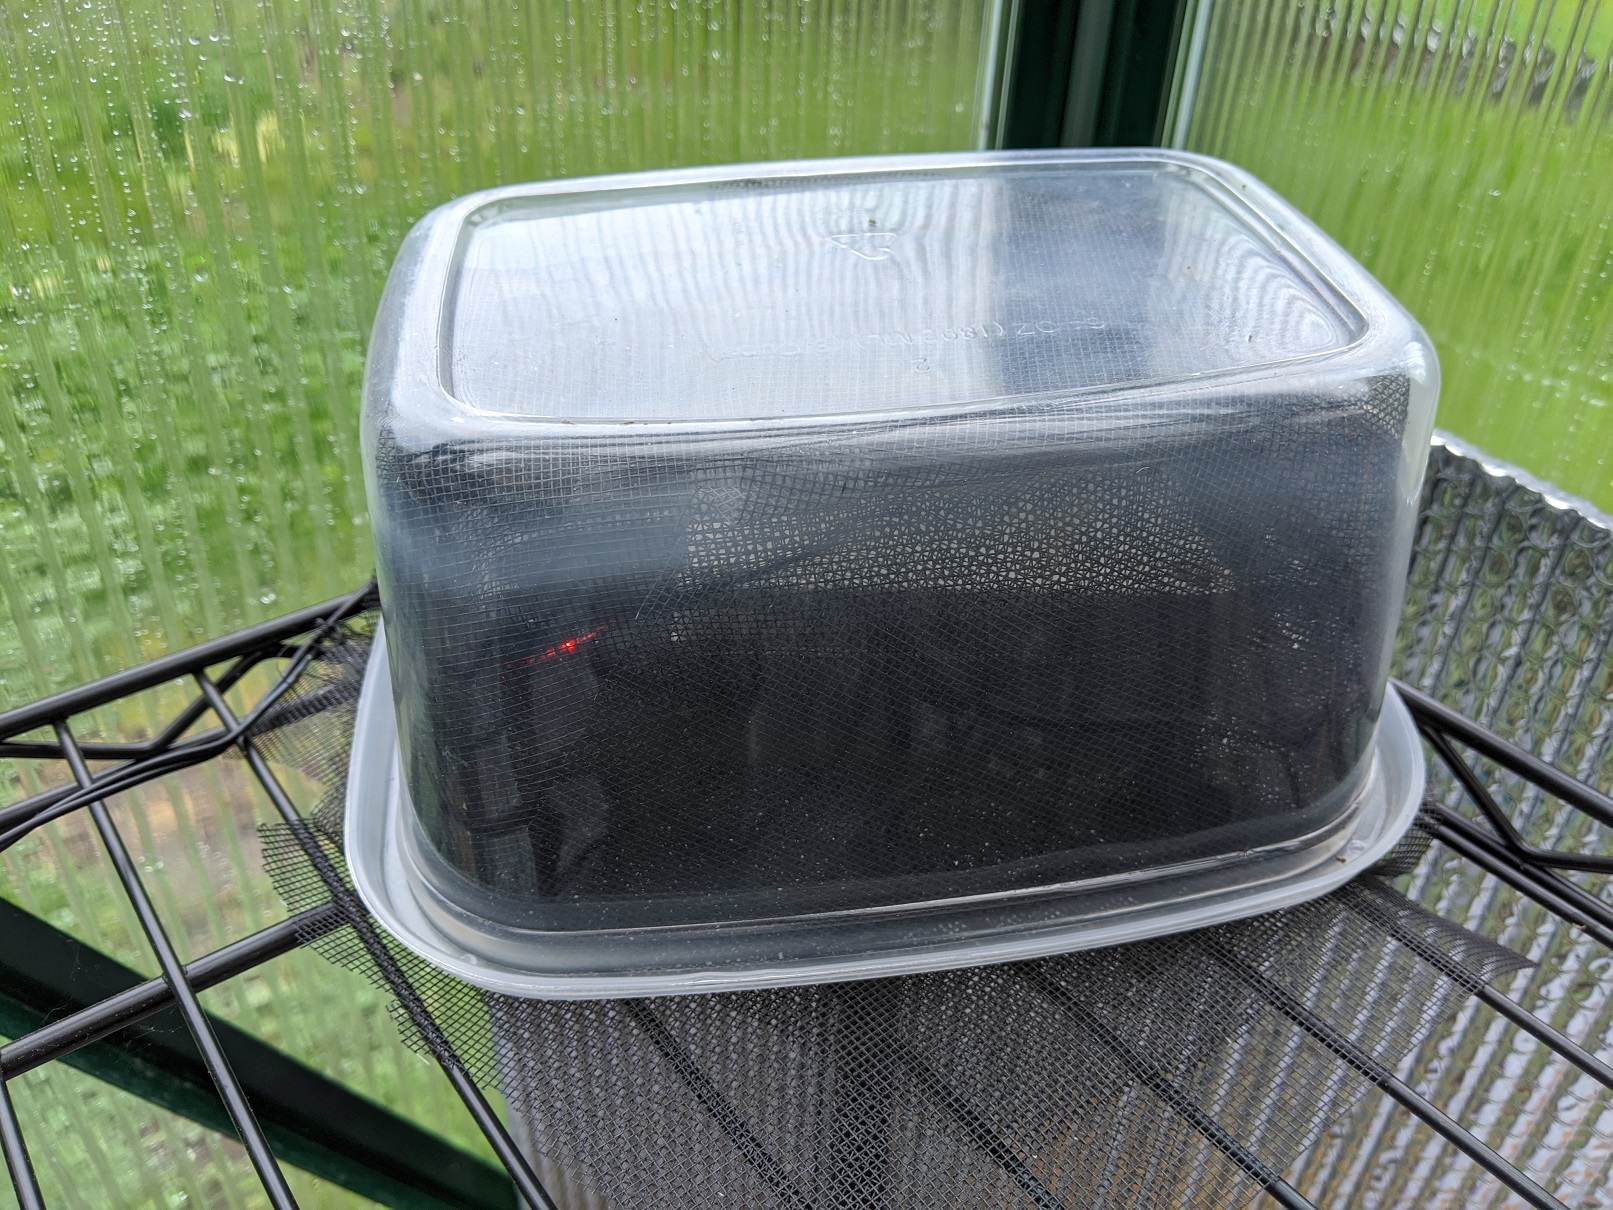
The first system is an environment monitor. It uses a DHT11 sensor to measure temperature and humidity, and an analog light intensity sensor to measure daylight. The light intensity sensor is more sensitive than I'd like, so I positioned it under a shade net. Total cost for this system was $20-$30.
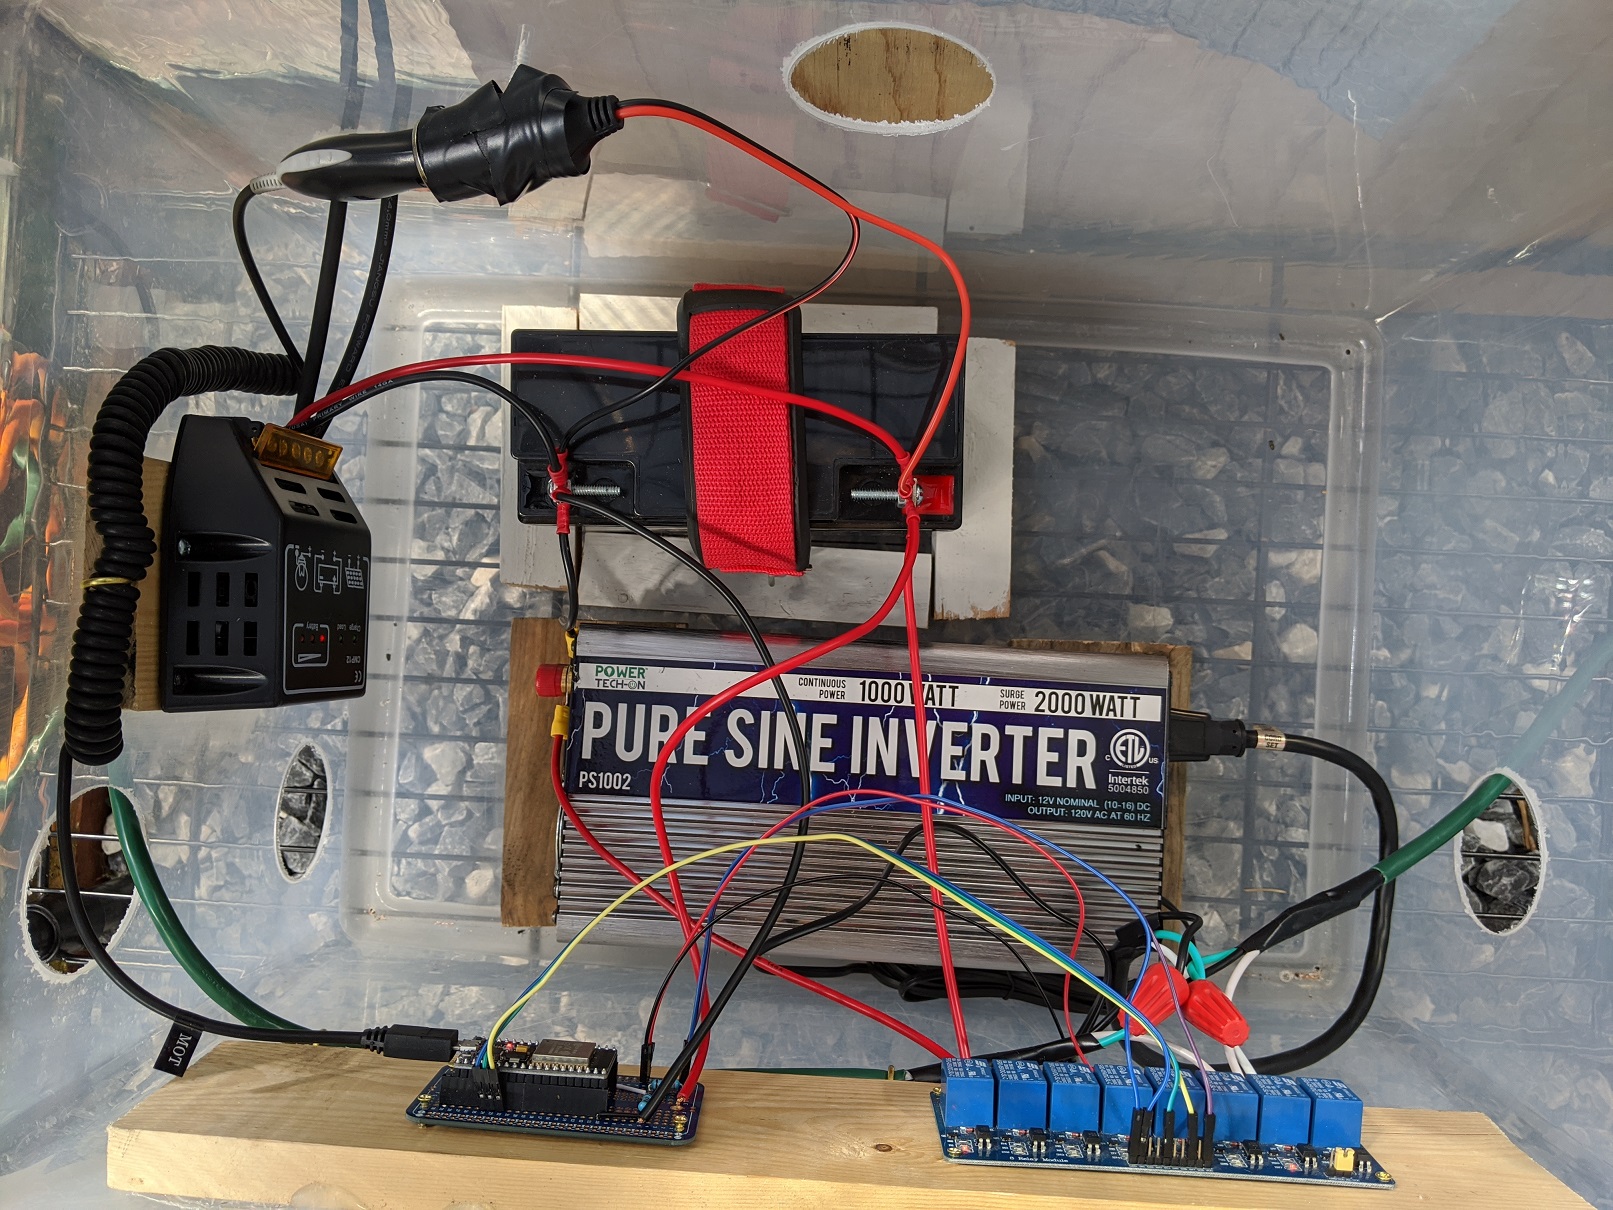
The power supply controller is more complicated than the environment monitor. It reads the voltage of a 12v solar system and decides whether the greenhouse should be powered by solar or the grid, then switches power supply accordingly. ESP32 is a 3.3v board, so a voltage divider is required to measure the solar voltage. A relay board closes some normally-open circuits when it's time to use solar power. This gives power to the inverter and switches the loads from grid to solar. However, after the circuit has been closed, I still need to press the power button on the inverter. To press the button automatically, I had to disassemble the wired remote that came with the inverter, and reverse-engineer the signal that the button sends, then send the same signal from the ESP32 instead. When it's time to go back on grid power, the inverter power button gets "pressed" again, and the relays are sent back to their normally-closed state. The solar system consists of a 100 watt panel, a charge controller, a 216 watt-hour rechargeable battery, and a 1-kilowatt pure sine wave inverter. Total cost for the power supply system was roughly $300, but half of that was the inverter, which has other applications.

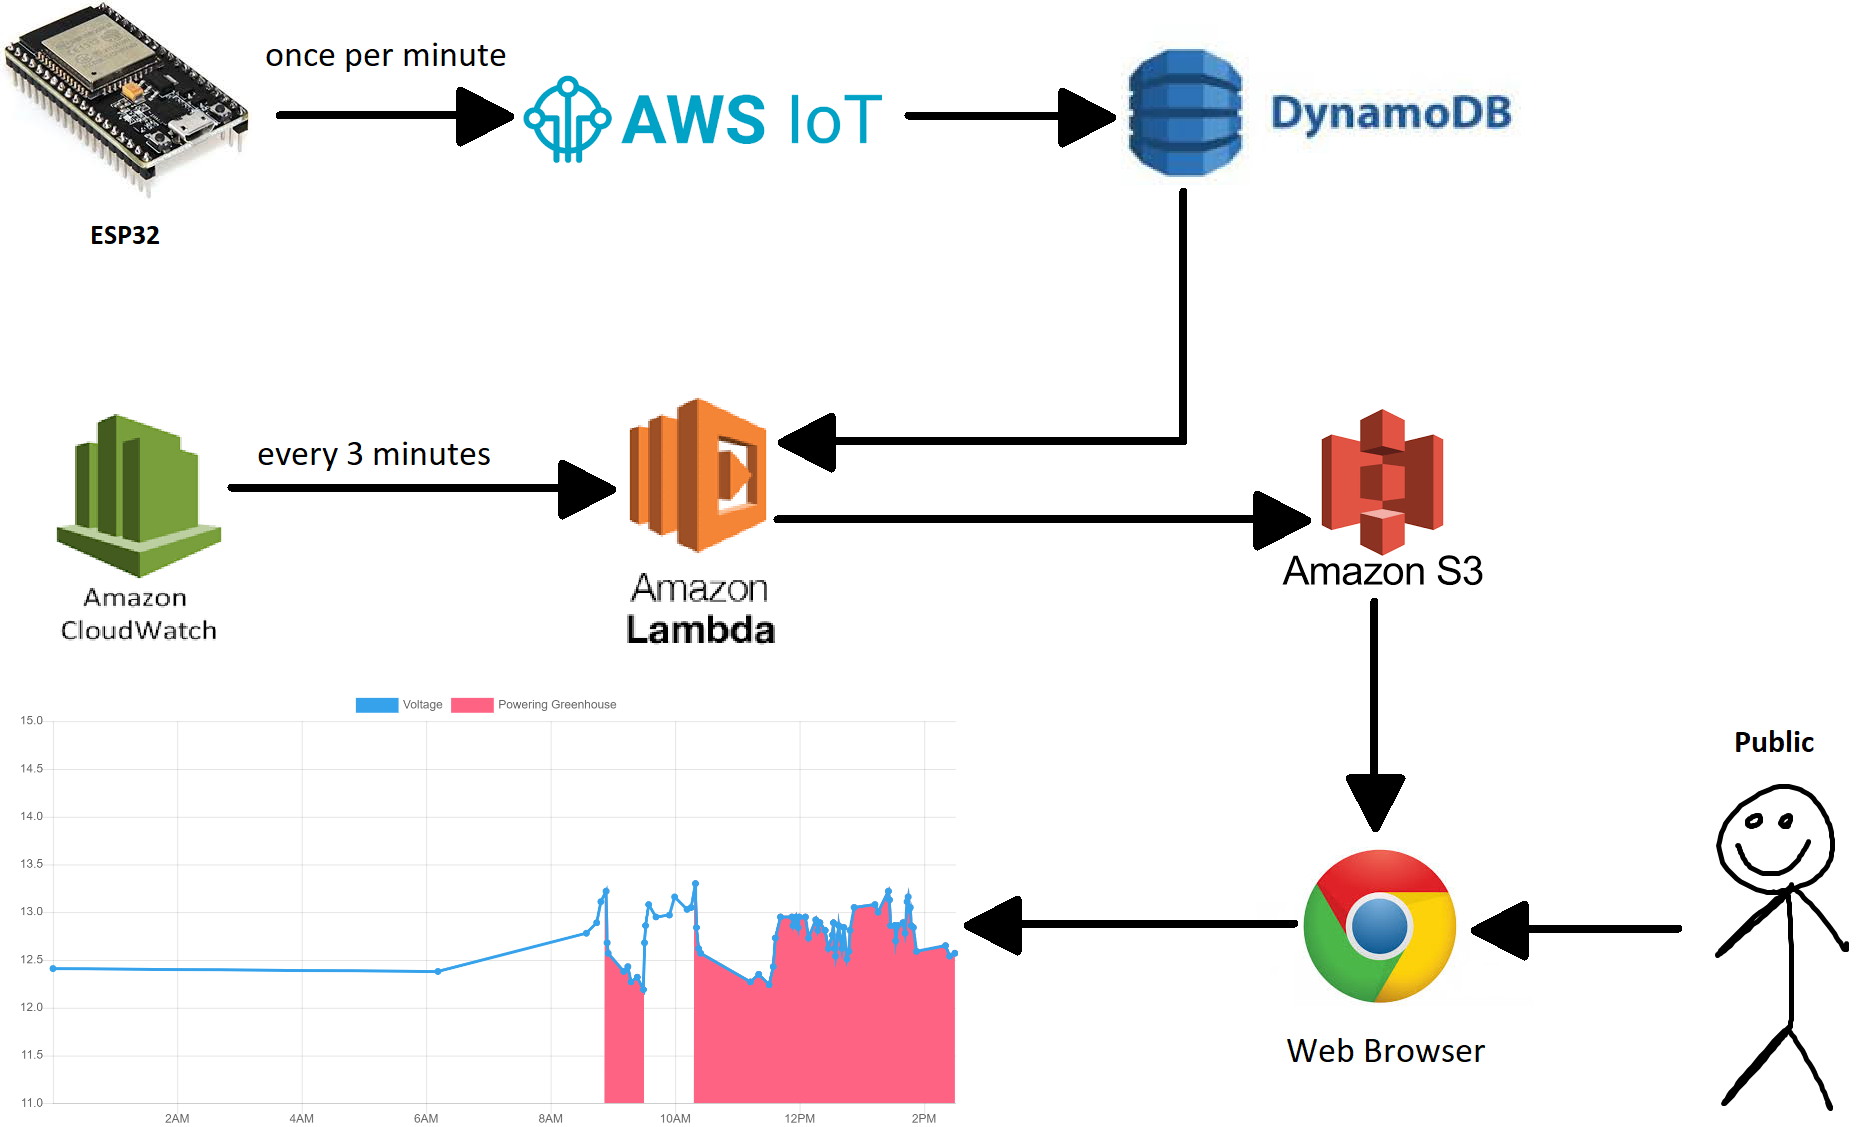
The backend software is serverless within AWS. IoT Core is used to format raw messages as time series data, which are then written to DynamoDB. The DynamoDB table is configured with a "Time to Live" attribute, which automatically deletes data older than one week. Data is archived in S3 before the delete happens. Users authenticate via Cognito, which authorizes them to call a Lambda function through API Gateway. This Lambda retrieves the trailing seven days of data from Dynamo DB.
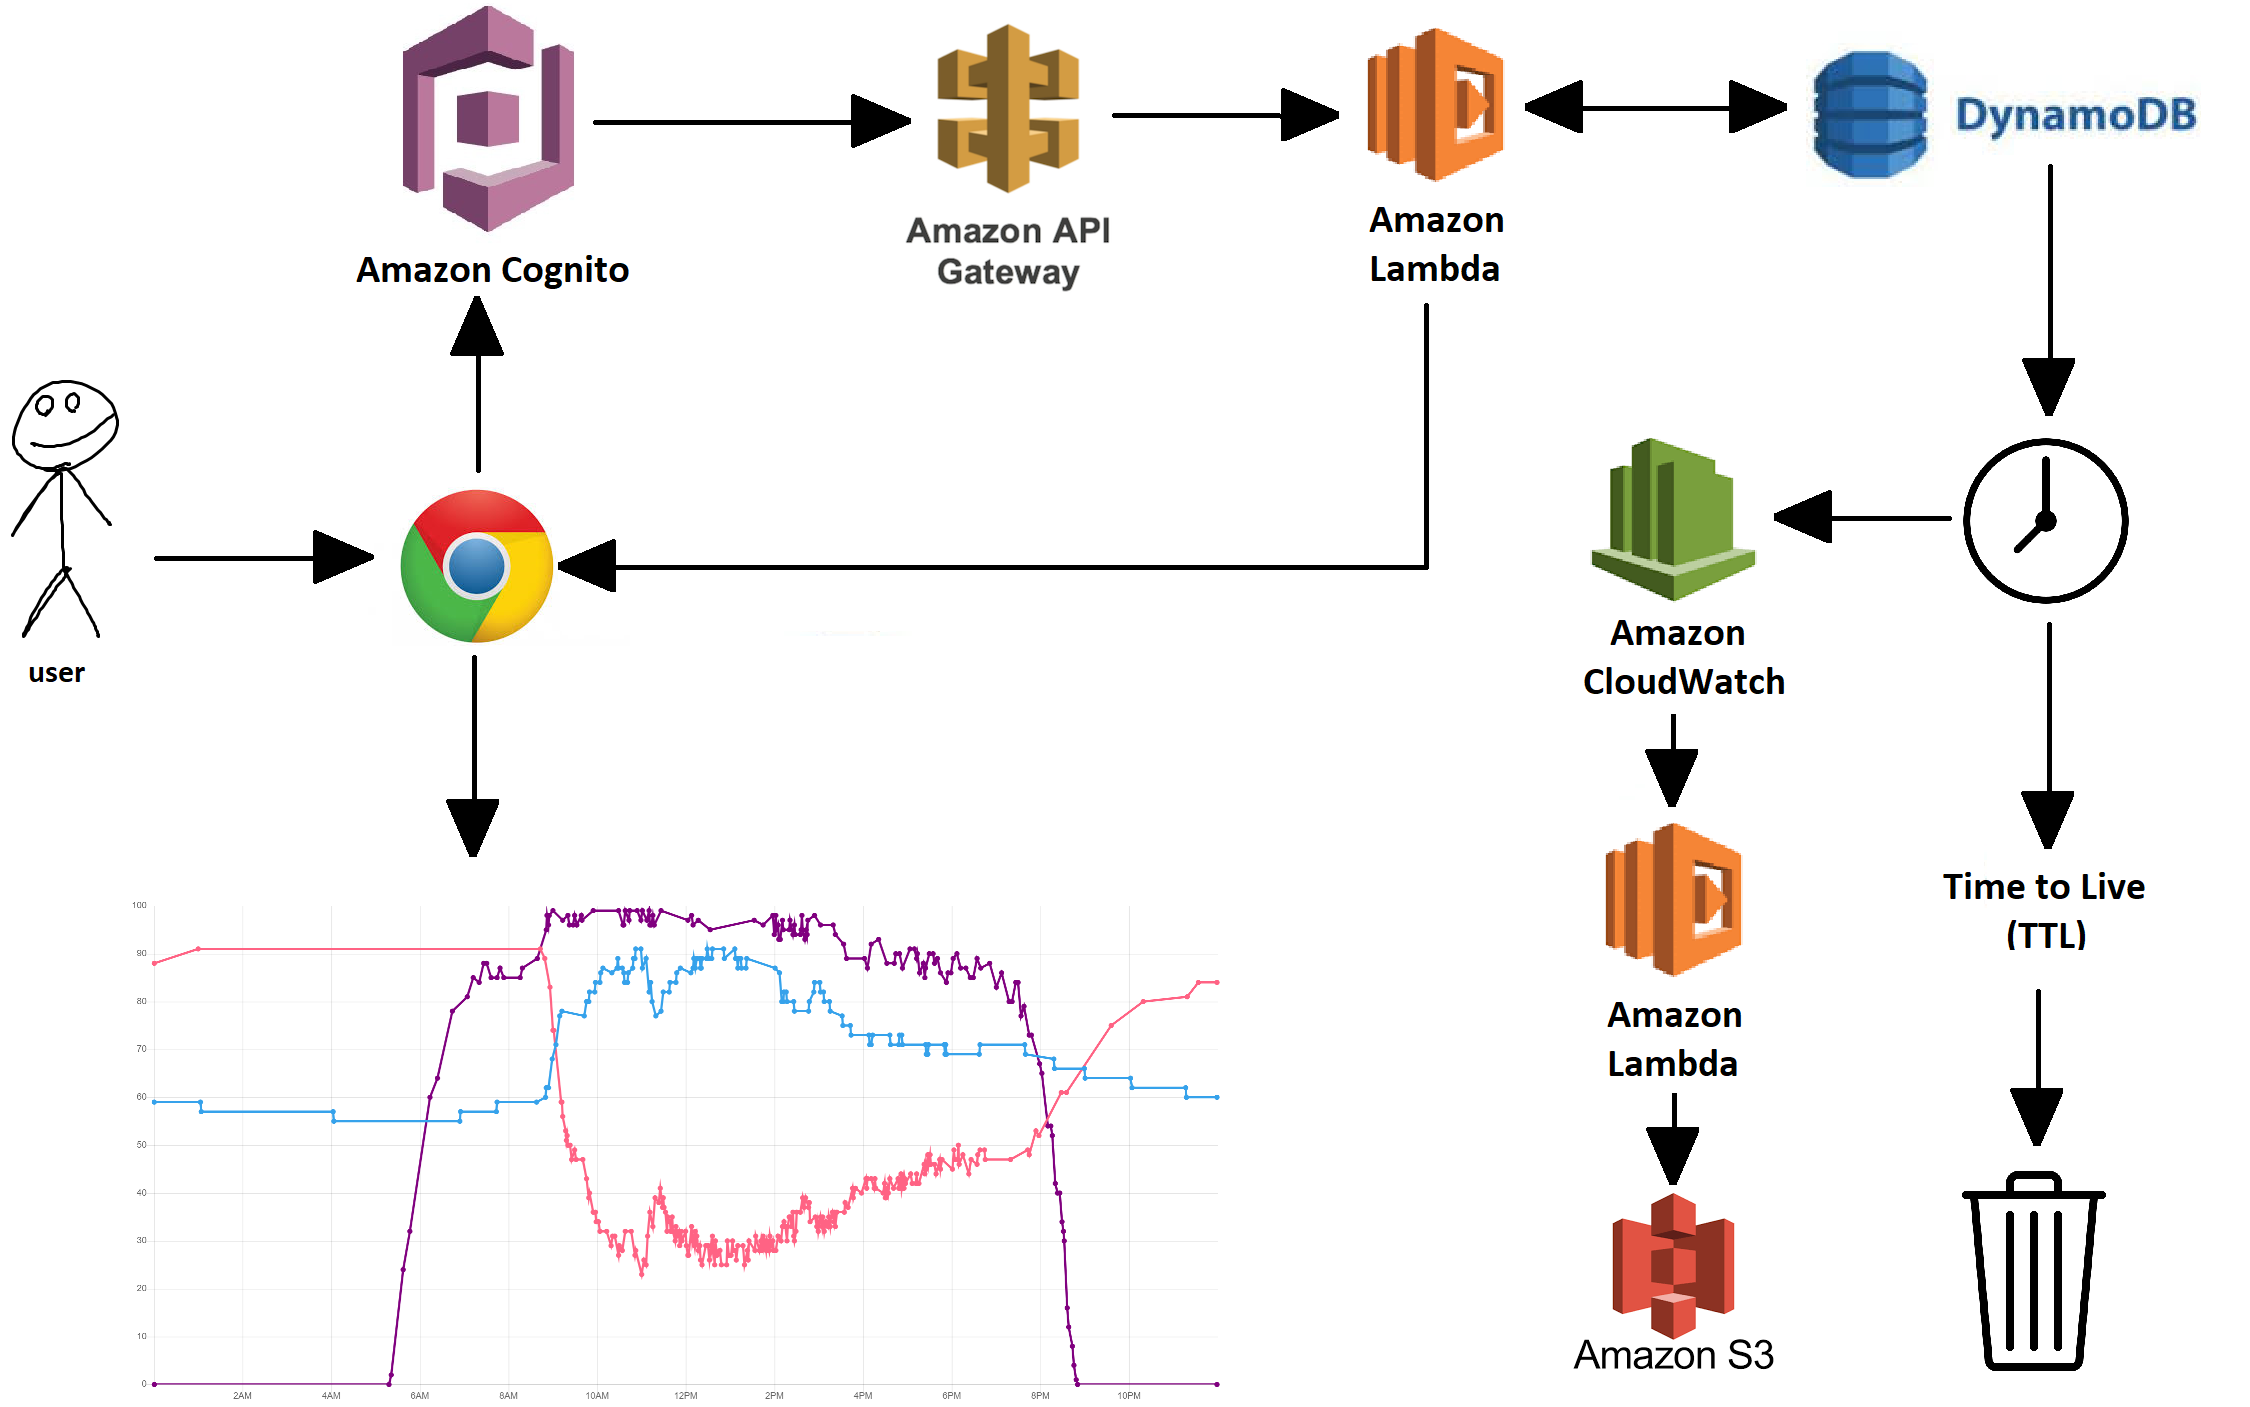
To make this site more interesting for the public, I decided to share the data from my personal account. Public access to DynamoDB and Lambda wouldn't scale well, however, so data is rotated asynchronously into S3. To do this, CloudWatch invokes a Lambda function every three minutes. This Lambda reads today's data from DynamoDB, and writes it to an S3 file. This public S3 file provides data to the dashboard page, which draws its graphs using chart.js. The website itself is an S3 static site with five html files. The whole application uses roughly a dozen AWS services, all running in the free tier. For all the Kanye fans out there that means my AWS bill is $Free.99!